Market Performance
- Client
- UL Solutions
- Industry
- Enterprise SaaS, compliance, data analytics
- Year
- 2024
- Role
- Product designer. Information architecture, interaction design, design system
The problem001
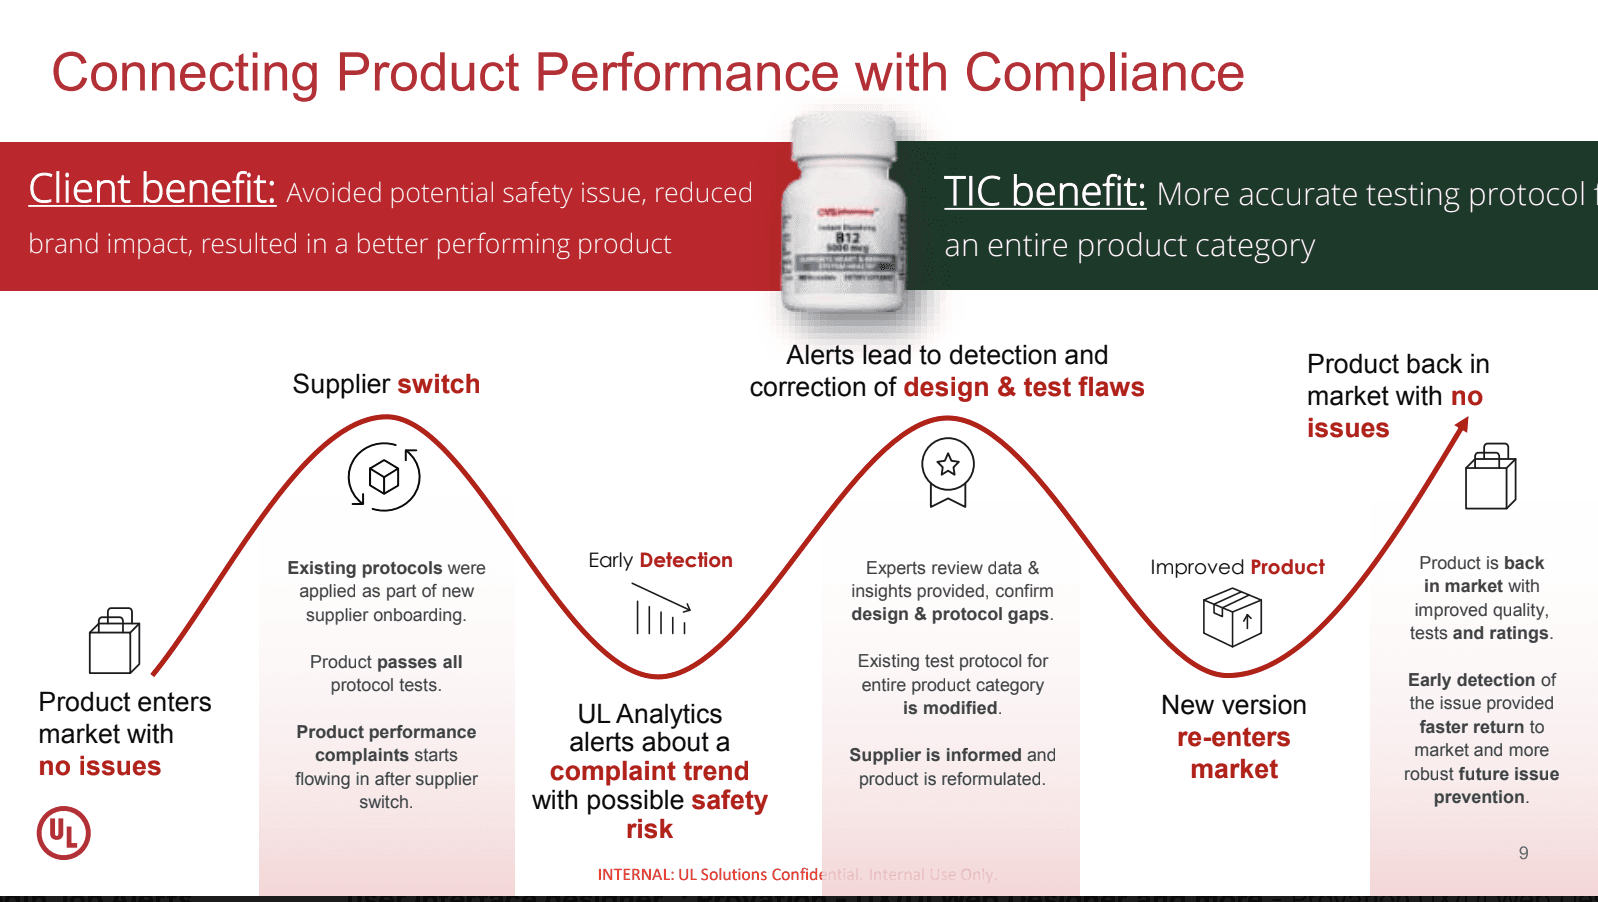
The data existed, but it lived in disconnected tools. Users couldn’t easily trace a complaint back to a product, a batch or a supplier, so quality issues were found late and investigated slowly.
Why it was hard002
01
Too much data, too little structure.
Product, complaint, sales and supply chain data all mattered, but showing everything at once helps nobody.
02
The investigation was split across tools.
Following one issue meant jumping between systems and joining the dots by hand.
03
Users had to decide, not just look.
A dashboard full of numbers doesn’t tell you what to act on first.
04
It had to grow.
New data sources and new teams were coming, so whatever we built had to stretch.
So the real job was connecting the data, not displaying it.
What I decided, and why003
01
Designed the information architecture around relationships.
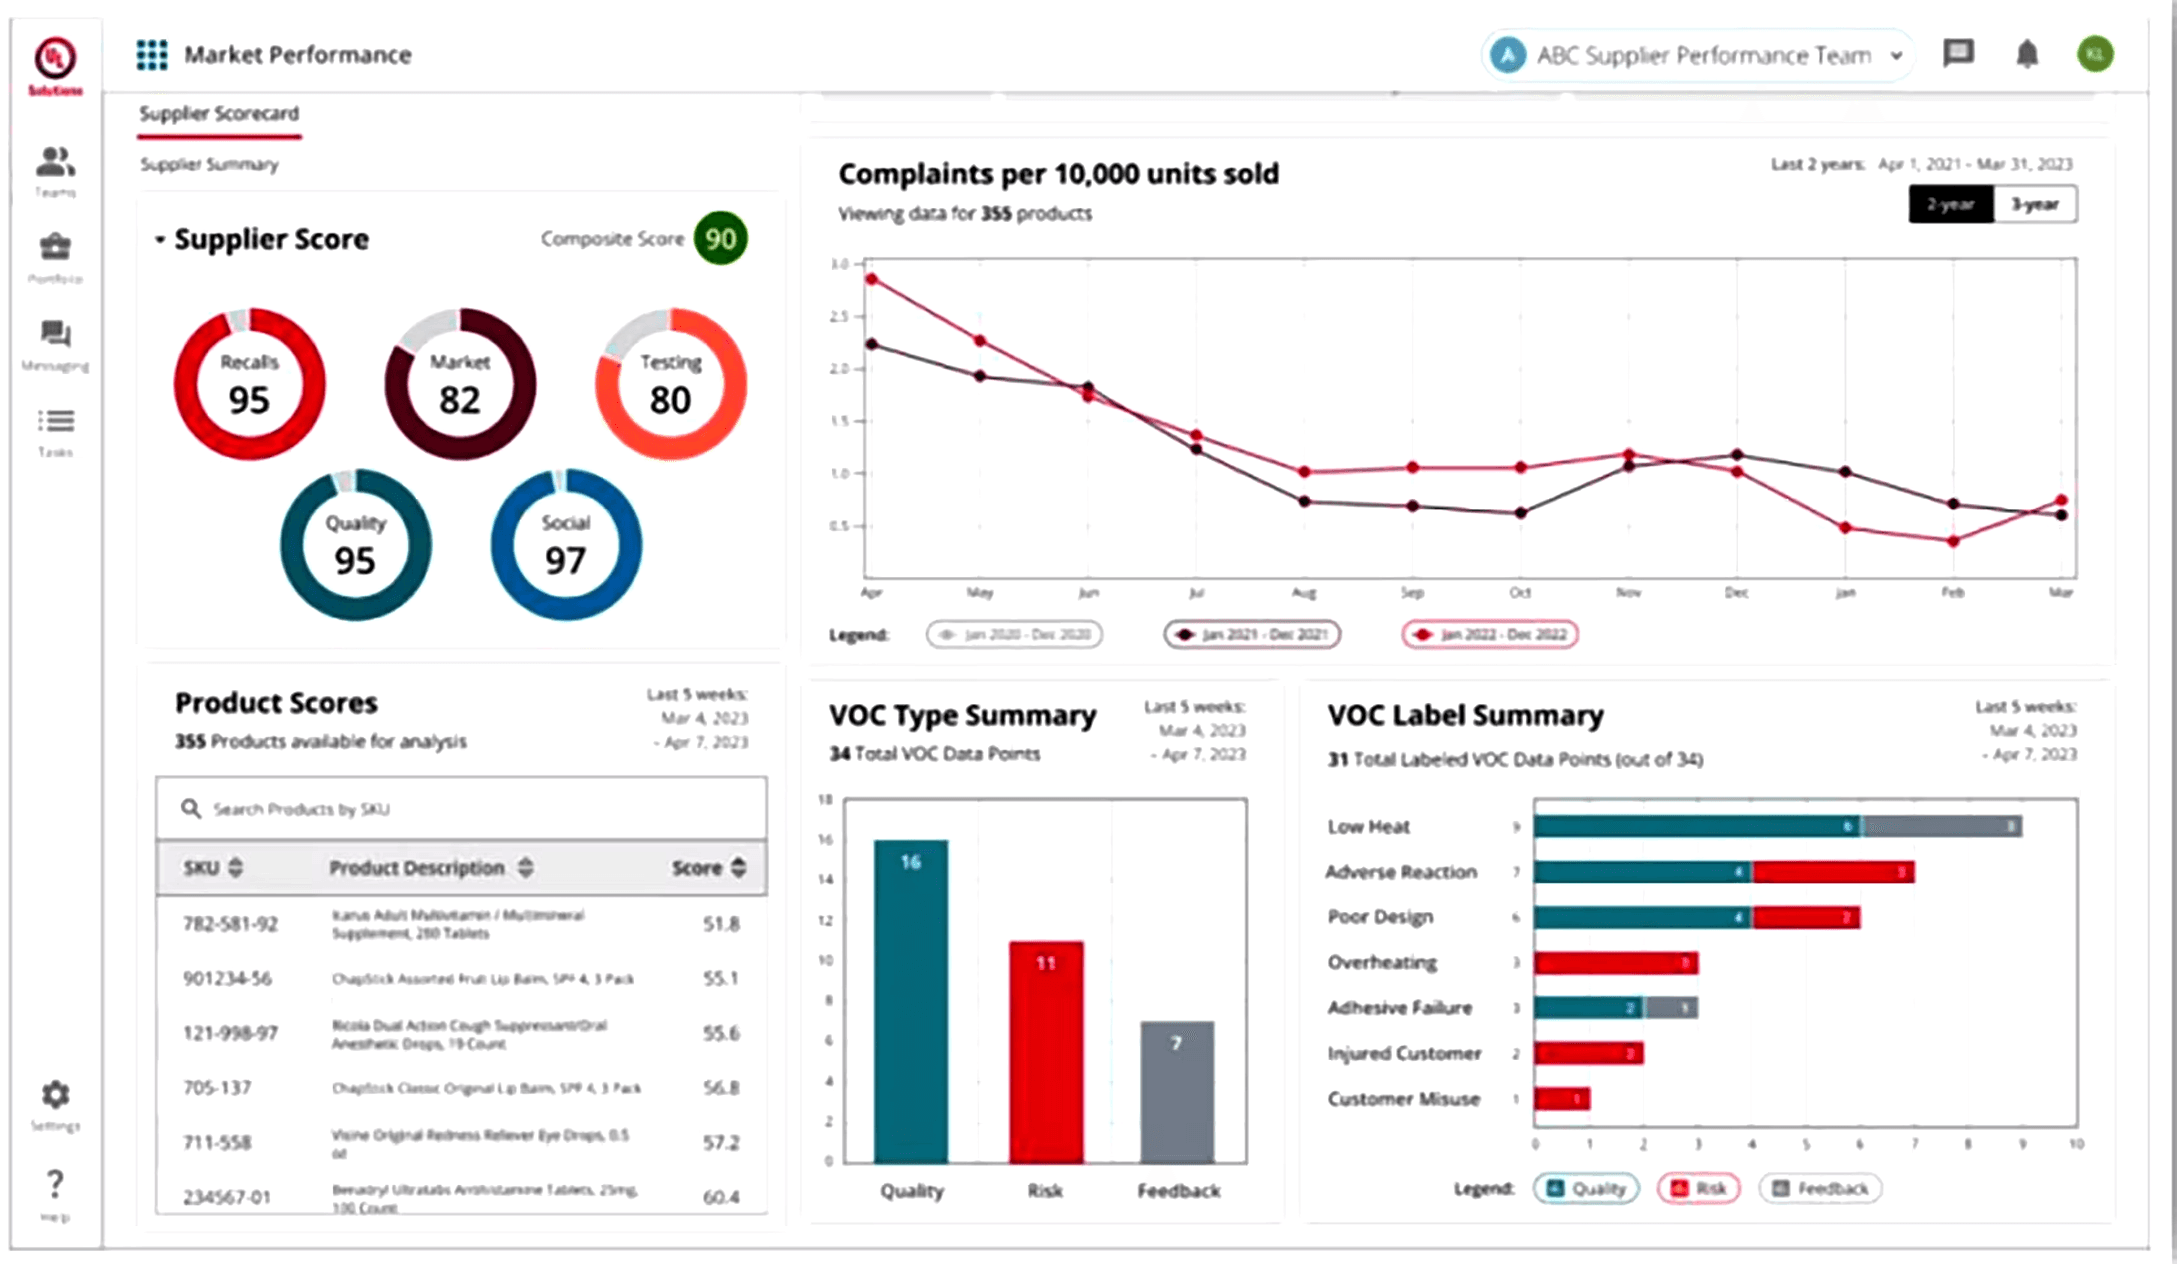
Product, batch, supplier and complaint were linked, so users could follow an issue end to end in one place.
02
Built screens around questions, not data sources.
Dashboards answered “what’s at risk and where,” and investigation views answered “why.” Fewer charts, more answers.
03
Showed patterns before detail.
Trends and flags came first, with the detail one click away, so users weren’t overwhelmed but could still dig in.
04
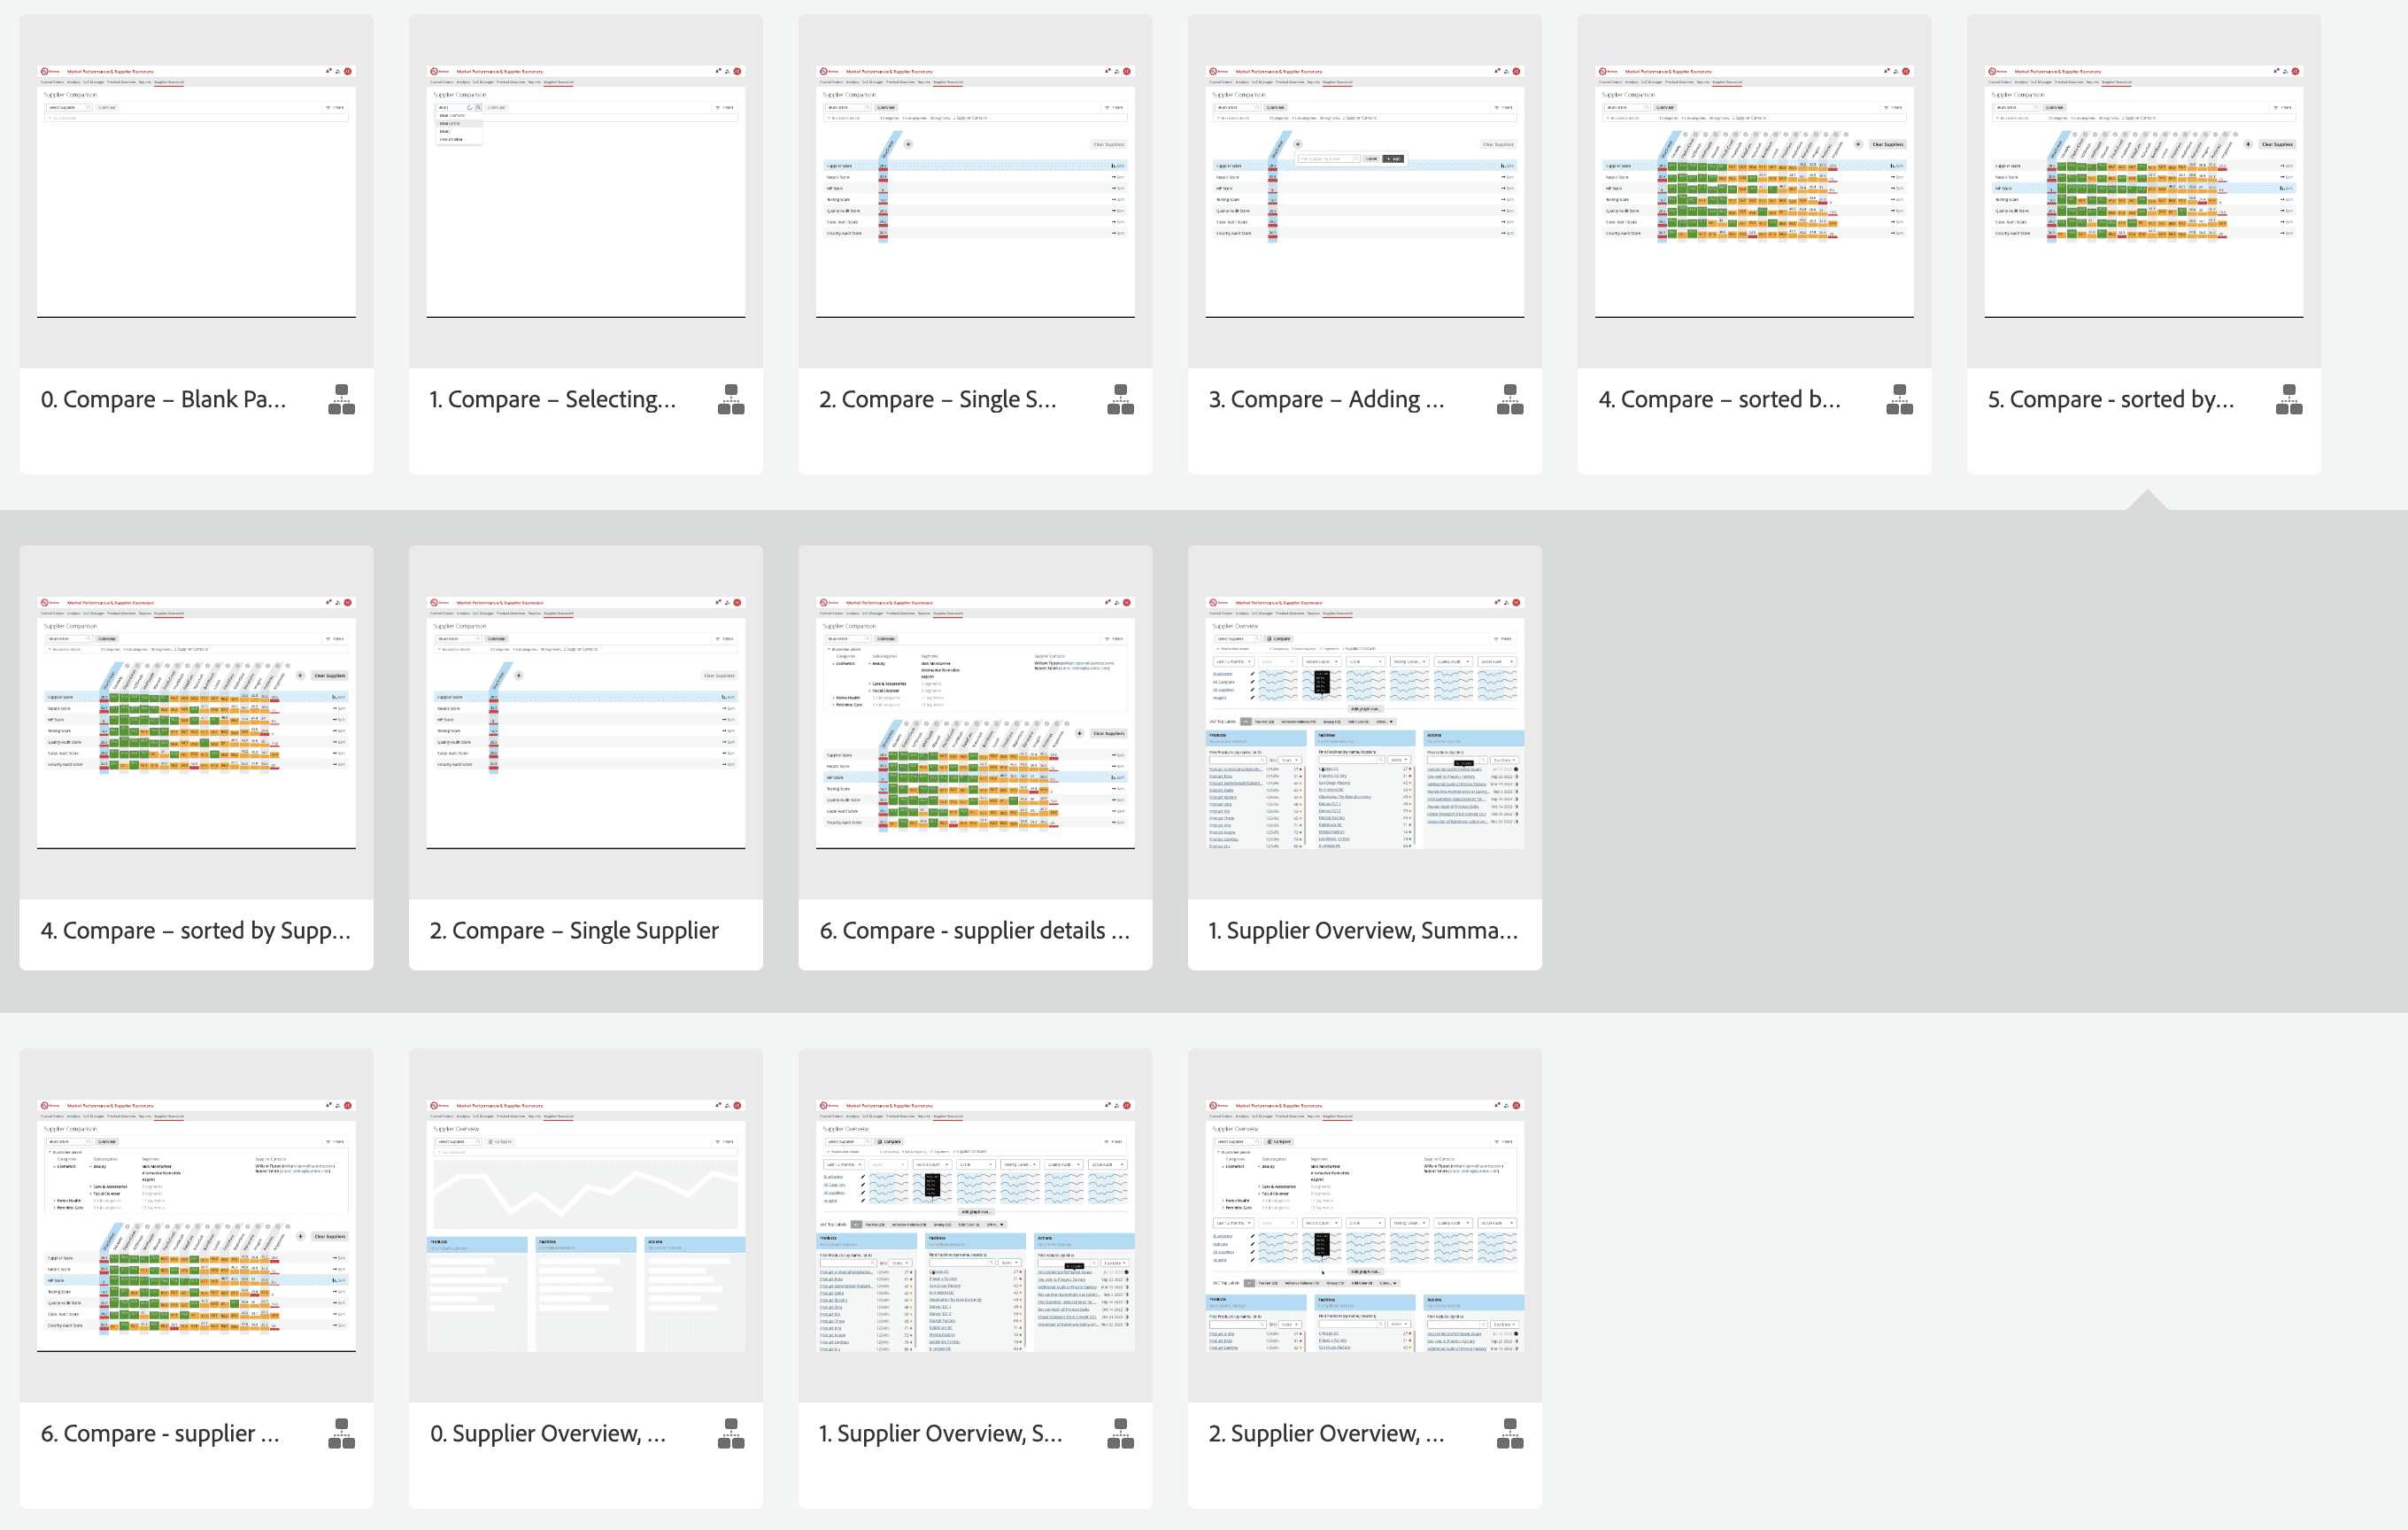
Created reusable components and patterns.
With more data and teams on the way, a shared system kept new screens consistent and quicker to build.
The result004
Investigations could happen in one connected workflow instead of across tools, risks were easier to spot and prioritise, and product, engineering and quality teams worked from the same design patterns.
What I’d do differently005
I’d define success metrics with the team early, such as time to trace an issue or time to first action, so the improvement could be measured, not just observed.
Explore projects